
What You Will Find Here
- How to Access Table Dispatch
- How to Create a Table Dispatch Chart
- What You Can Do with Table Dispatch
- FAQs
How to Access Table Dispatch
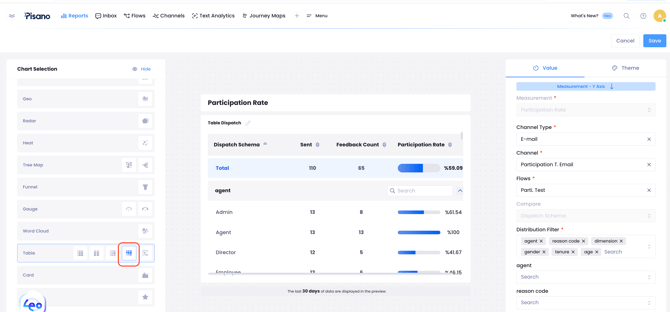
To access Table Dispatch:
- From the main navigation menu, click Reports.
- Open the chart creation interface in the Reporting module.
- Under Chart Selection, locate Table.
- Select Table Dispatch, the fourth chart option under Table.
The chart configuration panel opens, with Participation Rate selected as the default measurement.
Prerequisite: Dispatch type schema fields must be defined for the relevant Flow before you can use them in a Table Dispatch chart.
How to Create a Table Dispatch Chart
You can configure a Table Dispatch chart to analyze participation rates for specific channels, Flows, and Dispatch schema fields.
- Select Table Dispatch from the available table chart types.
- In the Value configuration panel, confirm that Participation Rate is selected under Measurement.
- Under Channel Type, select the relevant communication channel type.
- Under Channel, select the channel you want to analyze.
- Under Flows, select the relevant Flow.
- Under Distribution Filter, select the Dispatch schema fields you want to include in the analysis.
- Configure additional filtering options as needed.
- Review the chart preview and click Save to save your chart.
The resulting table displays participation statistics for the selected Flow and channel, organized according to the selected Dispatch schema fields.
What You Can Do with Table Dispatch
Analyze Participation Rates
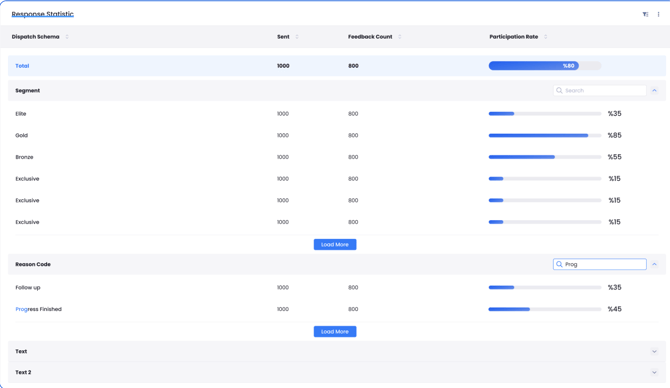
Table Dispatch displays three key measurements:
| Measurement | Description |
| Sent | Number of feedback requests sent. |
| Feedback Count | Number of feedback responses received. |
| Participation Rate | Percentage of sent feedback requests that resulted in responses. |
Participation Rate is calculated as: Participation Rate = (Feedback Count / Sent) × 100
The table displays these values alongside visual participation rate indicators, allowing you to compare response performance across different categories.
Explore Dispatch Schema Breakdowns
Table Dispatch organizes participation statistics using Dispatch schema fields and their values.
You can expand individual schema field sections to examine their associated values and participation rates.
For example, if your Flow includes Dispatch schema fields such as Segment and Reason Code, you can review participation statistics for each value within those fields.
The table also includes an overall Total row that summarizes participation statistics.
Filter and Search Table Data
You can narrow your analysis using the available configuration and table filtering options.
- Select the relevant Channel Type, Channel, and Flow.
- Under Distribution Filter, select one or more Dispatch schema fields.
- Use the additional field filters to select specific values where needed.
- Use the search field within a table section to find particular schema values.
The table displays the matching values and their participation statistics.
For sections containing additional values, click Load More to display more results.
Customize the Chart
You can adjust how your Table Dispatch chart is presented.
- Chart Title: Edit the chart title to describe the analysis.
- Data Labels: Customize the labels displayed in the chart.
- Theme: Use the Theme settings to adjust the chart's appearance.
Export Table Dispatch Data
Table Dispatch supports two export formats:
- CSV: Export the underlying table data for further analysis.
- PNG: Export the chart view as an image.
FAQs
What is required to create a Table Dispatch chart?
The relevant Flow must have Dispatch type schema fields defined. These fields provide the categories used to organize participation statistics.
How is Participation Rate calculated?
Participation Rate is calculated by dividing the number of feedback responses received by the number of feedback requests sent and multiplying the result by 100.
Can I analyze multiple Dispatch schema fields in the same chart?
Yes. You can select multiple Dispatch schema fields under Distribution Filter and examine their values in the table.
Can I filter results by channel and Flow?
Yes. Table Dispatch allows you to select a channel type, channel, and Flow to focus your analysis on the relevant feedback communications.
Can I export Table Dispatch results?
Yes. You can export table data in CSV format or save the chart view as a PNG image.