
What You Will Find Here
- Configure chart data
- Customize the chart appearance
- Configure sorting and display limits
- Apply filters to the chart
Who Can Access?
No access restrictions apply to this feature.
How to Access
- Click Reports from the main navigation.
- Open an existing report or create a new report.
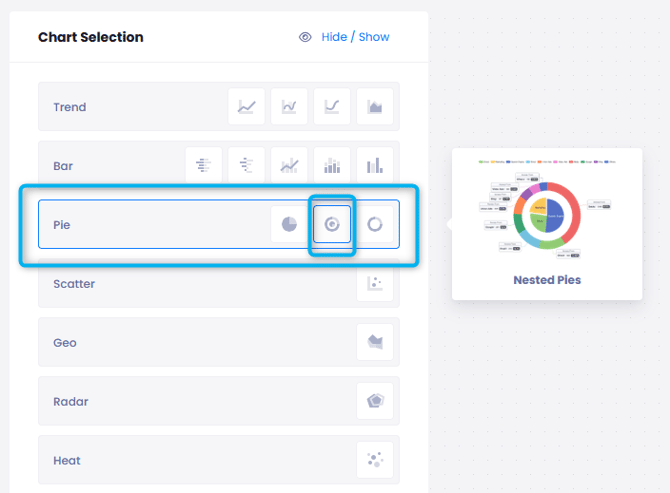
- Add a new chart and select Nested Pie Chart from the available chart types, or open an existing Nested Pie Chart.
- Open the Nested Pie Chart Configuration panel.
- Configure the chart using the following tabs:
- Value
- Theme
- Customize
- Filter

What You Can Do Here
Configure the Nested Pie Chart Data
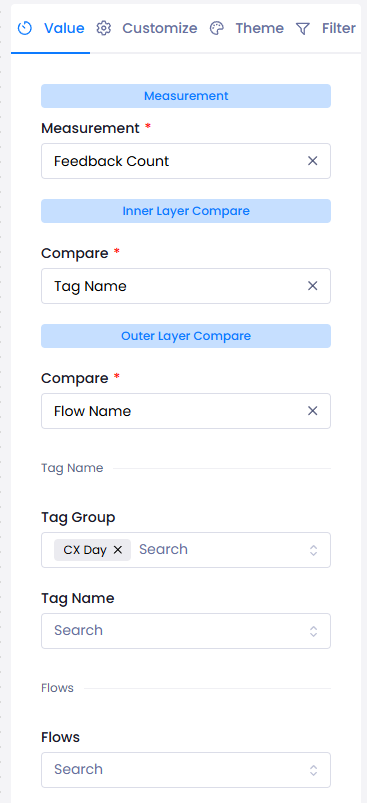
The Value tab controls which data is displayed in the chart and how it is organized across the Inner Layer and Outer Layer. You can select the measurement to calculate and define the comparison fields that determine how data is grouped.
- Open the Value tab.
- Select the measurement to calculate.
Available measurements include:
Feedback Measurement
- Feedback Count: Calculates the total number of incoming feedback responses.
- Response:
- Response Count: Calculates the total number of individual responses.
- Note: Selecting Response Count limits available comparison options to survey questions.
- Customer:
- Customer Count: Calculates the number of unique customers.
- Configure the Inner Layer Compare field to define the parent groups displayed in the inner ring.
- Configure the Outer Layer Compare field to define the related subcategories displayed in the outer ring.
- Select one of the available comparison categories:
Organization & Units Group chart layers by business locations or organizational units.
- Available option: Unit Name
- Note: You can select specific unit types if needed. Leave the selection empty to include all units automatically.
- Note: Feedback history is mapped from its point of origin to its final handling channel. This ensures accurate reporting even if feedback is reassigned between teams.
User Assignments Group data by assigned users.
- Available options include:
- Assigned User
- Archiving User
- Responsible User
- Note: Leave the selection empty to display data across the entire team.
Journeys & Flows Group data by feedback flows.
- Available option: Flow Name
- Note: Select one or more active flows. Leave the selection empty to include all active flows.
Customer Profiles Group data using customer information.
- Available options include:
- Customer Company: Displays company records associated with business contacts. You can select specific companies or include all companies.
- Customer Schema: Displays customer profile attributes such as Gender, Region, or Tier. Selecting a customer schema automatically displays every matching value imported from your integrated customer profiles.
Survey Questions & Answers Group results using survey questions and responses.
- Available options include:
- Question Title / Response
- Option
- Question Key
- Question Category Name
- For Option: Select the flow, the survey question, and one or more answer choices.
- For Question Key: Select the flow that contains the custom key and the required key values.
- Question Category Name: Groups responses by shared survey themes, such as NPS or Sentiment.
Tags & Labels Group results using tags.
- Available options include:
- Tag Name
- Tag Group
- Intelligent Tag
- Note: Selecting a Tag Group automatically limits the available tag list to its related child tags.
Time Period Group results by time.
- Available options include:
- By Hour
- By Day
- By Month
- Note: If the selected date range exceeds one year, month labels automatically include the calendar year (e.g., March 2025 and March 2026).
Content Categories Group results by structured feedback topics.
- Available option: Content Category Name
- Note: Enable Include Subcategories to include every child topic beneath the selected parent category automatically.
Channels Group data by communication channels.
- Available option: Channel Name
- Available channel types include: Link, E mail, SMS, Web, Mobile, CATI.
- Note: Select one or more active channels, or leave the selection empty to include every active channel.
Case Status Group results by feedback status.
- Available option: Feedback Status
- Available statuses include: Open, Archived, Reopen, Queued, In Progress, Incomplete.
Result The Nested Pie Chart displays the selected measurement using an Inner Layer and an Outer Layer based on the configured comparison fields.
Notes
- Selecting Response Count limits available comparison options to survey questions.
- Leaving supported comparison selections empty automatically includes every available record for that category, such as all units, all active flows, all channels, or all users.
Customize the Chart Appearance
The Theme tab controls how the Nested Pie Chart looks. You can configure the chart title, apply styling, select series colors, and customize data labels.
- Open the Theme tab.
- Expand Title Properties.
- Enter a Graphic Name.
- Configure the title appearance by selecting: Font, Color, Size, and Bold formatting.
- Configure the chart's series colors using the Theme option.

Result The chart appearance updates immediately in the live preview.
Notes
- If Graphic Name is left blank, the system displays a reminder before saving.
- If title styling properties are left blank, default styling is applied automatically.
Customize Sorting and Limits
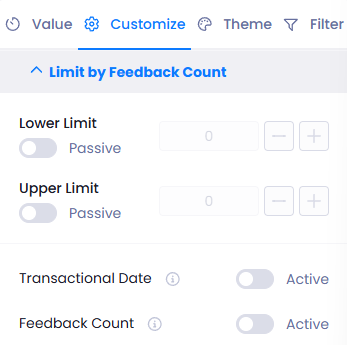
The Customize tab controls how chart data is ordered and which values are displayed.
- Open the Customize tab.
- Select the sorting order: Ascending or Descending.
- Expand Limit by Feedback Count.
- Enable Lower Limit and enter a minimum value if required.
- Enable Upper Limit and enter a maximum value if required.
- Turn the Transactional Date switch on or off.
- Turn the Feedback Count switch on or off.
Result The chart displays data according to the selected sorting order and limit settings.
Notes
- Sorting and display limits affect how data appears in the chart.
- These settings do not change the configured Inner Layer Compare or Outer Layer Compare fields.
Apply Filters to the Chart
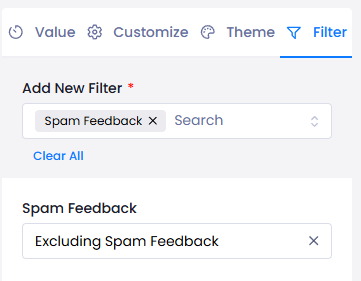
The Filter tab lets you narrow the displayed data without changing the configured chart structure.
- Open the Filter tab.
- Click Add Filter.
- Add one or more filters from the available list:
- Assigned Users, Channel Types, Channels, Content Categories, Feedback Status, Flows, Intelligent Tag, Tags, Tag Groups, Languages, Feedback Specifics, Question, Question Options, Spam Feedback, Unit Types, Units.
- For Feedback Specifics, you can choose: Only Feedback with Comments, Only Feedback with Contact Info, or Only Negative Feedback.
- For Spam Feedback, you can choose: Exclude spam feedback or Display only spam feedback.
Result The Nested Pie Chart displays only the records that match the configured filter conditions.
Notes
- You can combine multiple filters within the same chart.
- Applying filters does not change the configured Inner Layer Compare or Outer Layer Compare fields.
Limits / Notes
Keep the following information in mind when working with Nested Pie Charts:
- A Nested Pie Chart is a specialized version of a traditional pie chart.
- Unlike a standard pie chart, which displays a single level of data, a Nested Pie Chart displays hierarchical relationships using two concentric rings.
- The Inner Layer represents broader parent groups.
- The Outer Layer represents the related subcategories that belong to each parent group.
- The chart configuration is organized into four tabs:
- Value for selecting measurements and comparison fields.
- Theme for configuring design elements.
- Customize for configuring sorting, display limits, and visualization behavior.
- Filter for narrowing displayed results without changing the configured chart structure.
FAQs
How is a Nested Pie Chart different from a standard pie chart? A standard pie chart displays a single level of data. A Nested Pie Chart displays two hierarchical levels using an Inner Layer and an Outer Layer. This allows you to view parent categories and their related subcategories in the same chart.
What happens if I leave comparison selections empty? For supported comparison types, leaving a selection empty automatically includes every available record for that category. For example, the chart can include all units, all active flows, all channels, or all users.
Can I apply multiple filters to a Nested Pie Chart? Yes. You can add multiple filters from the Filter tab to narrow the displayed data. These filters do not change the configured Inner Layer and Outer Layer comparison fields.