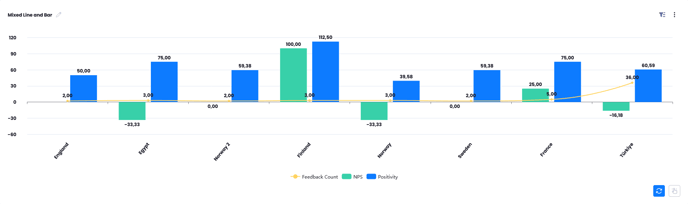
One measurement can be selected for the line, up to three for the bars (Y-axis), and one for the comparison (X-axis).
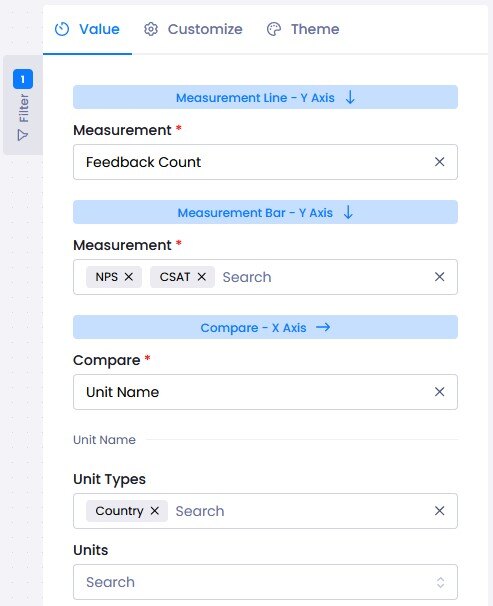
Multiple selections can be made from the menus that appear based on the comparison choice.
Data filtering can be customized as desired using the Filter tab.
With the "Sort by Number of Feedback" options, data can be simplified by setting lower and upper limits.

In the Theme tab, the text color, font, and size of the chart and axes can be customized. The main theme can be changed from the Series category.