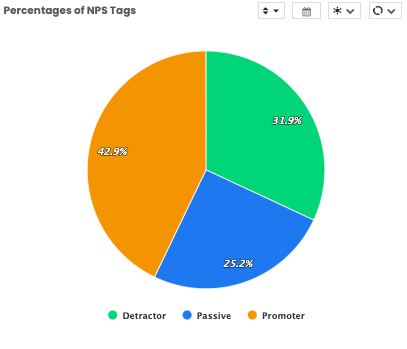
With the pie chart, you can show the percentages of the answers to the question in your flow.
In the pie chart, the answers given in question types such as Single Choice, Multiple Choice, CSAT, NPS, and the ratios of Label-based options can be displayed.
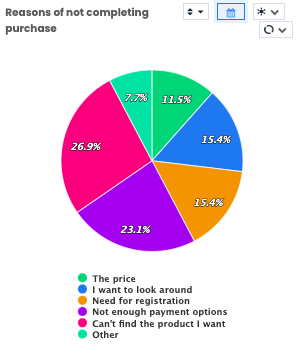
As in the example below, if you want to show the number of feedback given according to the options of a question you asked, follow the below steps;
In the pie chart, the answers given in question types such as Single Choice, Multiple Choice, CSAT, NPS, and the ratios of Label-based options can be displayed.
As in the example below, if you want to show the number of feedback given according to the options of a question you asked, follow the below steps;
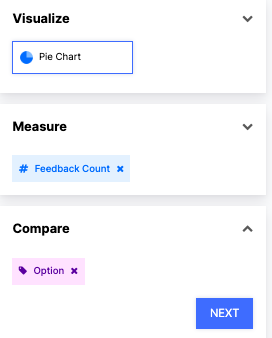
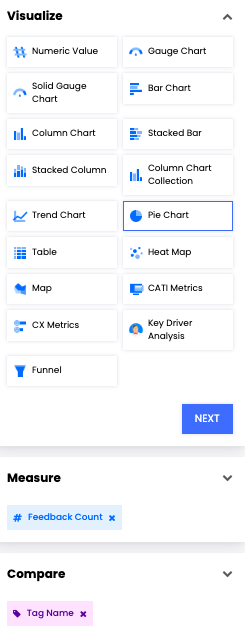
- Select Pie Chart from Visualize
- Select Feedback Count from Measure
- Select Option from Compare
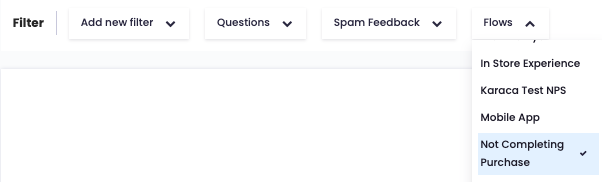
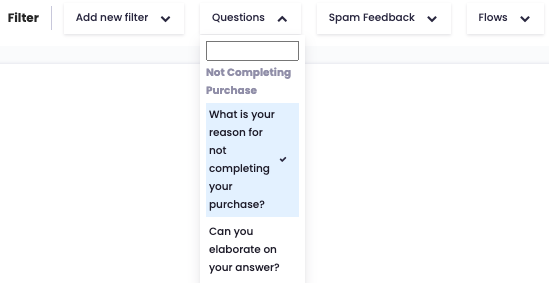
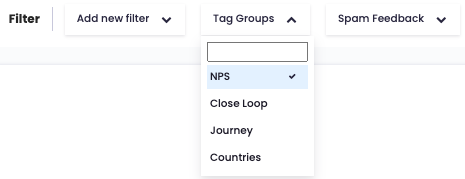
From the Filter section, add Flow and Question filters and choose the data you want to show on the Pie Chart.
After choosing your filters, click "Create Widget" and your widget should appear as below.
As in the example below, if you want to show the number of the feedback given according to the tags, follow the below steps;
- Select Pie Chart from Visualize
- Select Feedback Count from Measure
- Select Tag Name from Compare
From the Filter section, add Flow and Tag Groups or Tags filters and choose the data you want to show on the Pie Chart.
After choosing your filters, click "Create Widget" and your widget should appear as below.