- Select Bar Chart from Visualize
- Select the data you wish to measure from Measure, such as Feedback Count.
- Select what you want to Compare, for example, if you want to compare the Feedback Count of different Flows you should select ''Flow''.

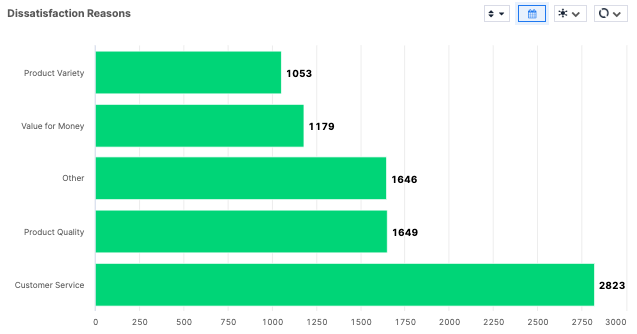
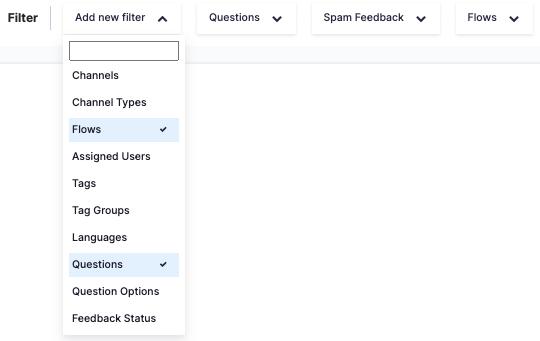
You can see below a Bar Chart example that shows Feedback Counts of Dissatisfaction Reasons. In order to create this widget follow the above steps and then add Flow and Question from the Filters as seen below.
 After specifying your flow and question, your Bar chart should appear as below.