- Knowledge Base
- Reports
- Reporting 2024
Table Chart in Reports
With the table chart, you can show the results of the subunits in the hierarchy of your account separately in the same widget.
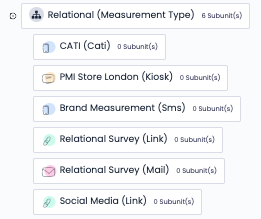
In the example below, you can see that there are 6 subunits under the main Relational unit. Let's think of these six units as six different branches and suppose we are going to prepare a report in which we will show the feedback counts of these six different branches.

To have branch-by results in the report, follow the below steps;
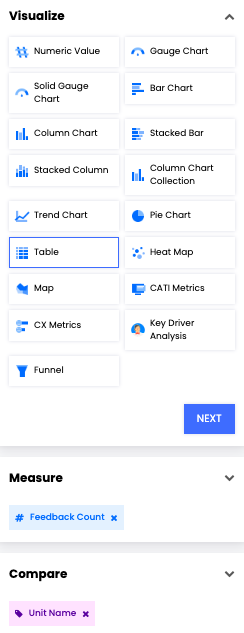
- Select Table from Visualize
- Select the data you wish to measure from Measure, such as Feedback Count.
- Select Unit Name from Compare.

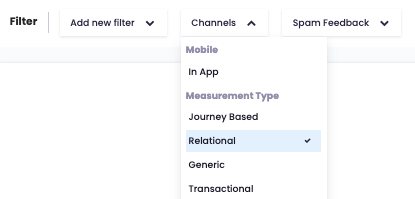
- From Filters, add Channels and select your main unit.

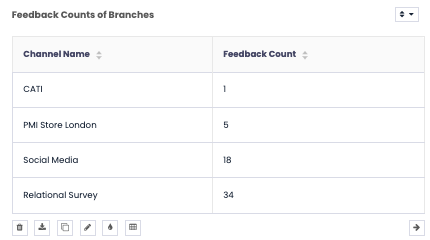
- After clicking "Create Widget" you should be able to see a table widget like the below example.

